Console Tour
Overview
The Limelight XE Console application allows users, operators and administrators the ability to communicate with any Limelight XE server. The application runs natively under Windows and connects to the server via TCP protocol and has persistent connection. This allows real time updates for alarms, logs and tracking data. Below is an overview of each of the tabs - visibility of each is dependent on the user's credentials.
For more information, and an in-depth breakdown of each tab of the limelight XE Console and its functionalities visit our documentation page:
Common features
There are two main features of every tab in the Limelight XE Console:
- The Main Menu Panel:
- File:
- Print and export console and database logs.
- View:
- Allows you to launch the procedure panel.
- Enter the full-screen mode.
- Edit, and fully customize the layout and style of your console.
- Tools:
- Launch the Remote Database Table Manager.
- View and set alarm priorities.
- Help:
- Navigate to the Limelight XE documentation library for on-demand questions and answers.
- Register and update your server registration.
- Install and update product licenses.
- File:
- The Status Bar:
Service Control Tab
The Service Control Tab is your landing page and login point to any Limelight XE server. The tab can be broken down into two main components.
- Login Field/ Server Address and Port
- Login and password port.
- Server address and server port.
- This will automatically populate based on login and registration.
- Service Log
- Server timestamp and log of connected/running engines.

Alarms Tab
The Alarms Tab is where you can view current alarms, notifications and their correlating procedures, acknowledge, force, and rescind alarm ownership, manage alarms and their notifications, and view all associated log entries for current and past alarms. The tab can be broken down into six main components:
- Alarm List Window
- View a current list of alarms, its timestamp, location, and alarm owner.
- Log Entries
- Associated log entries for the selected alarm, including its type, code, time, account GUID, etc.
- Alarm Ownership
- Allows you to acknowledge, force, or rescind alarm ownership.
- Alarm Management
- Allows you to silence, suppress, reset, or silence all alarms.
- Alarm Source Details
- Allows you to search and locate objects associated with an alarm or account.
- Procedure
- Allows you to view procedure tasks and actions, and complete, fail or abort them.

Logs Tab
The Logs Tab allows you to view any or all of the server logs. Users can sort by category as well as export and clear logs, search for server objects that appear in the component view or locate the physical object on the map tab. The tab can be broken down into four main components:
- Log Entry Window
- View and search through a complete list of log entries, export, and clear the log from the database.
- Object Details
- View the object details from the selected entry and find the associated object/account.
- Log Entry Details
- View log entry details such as the entry ID, entry code, timestamp, account user, module name, and description.
- Additional Information
- View any additional information provided in the entry.

Mapping & Tracking Tab
The Mapping & Tracking Tab allows you to view active objects, devices, assets and more. It is the central mapping and tracking control point in the console and has four sub-tabs.
Map Sub-Tab
This tab can be broken down into eight major sections:
- Main Map Display
- Pan and zoom to view all active objects being tracked by the current Limelight XE server.
- Map Layer Settings
- Temporarily alter layer settings by checking and unchecking options. These can be set permanently by using the map settings dialog found under VIEW -> OPTIONS -> MAP SETTINGS... in the main menu or by clicking the gear symbol on the map control tool bar.
- Object Filters
- Limit the visible objects by classification using these filters
- Overview Map
- Gain situational awareness by setting this auxiliary map at higher or lower zoom levels to the main map.
- Map Viewing Options
- Temporarily set position lines or range rings on the main map.
- Fixed Assets and Devices
- Set the location or find fixed assets (e.g. buildings, equipment, etc.) or devices (e.g. cameras, gate operators, etc.).
- Fleet / Group Members
- Quickly add, delete or edit fleet members as well as locate or track fleet members using the associated controls.
- Location Presets
- Quickly add, delete or edit location presets. Users can quickly locate specific views that are stored here as well as a single default (main) location (e.g. a home base).
![]()
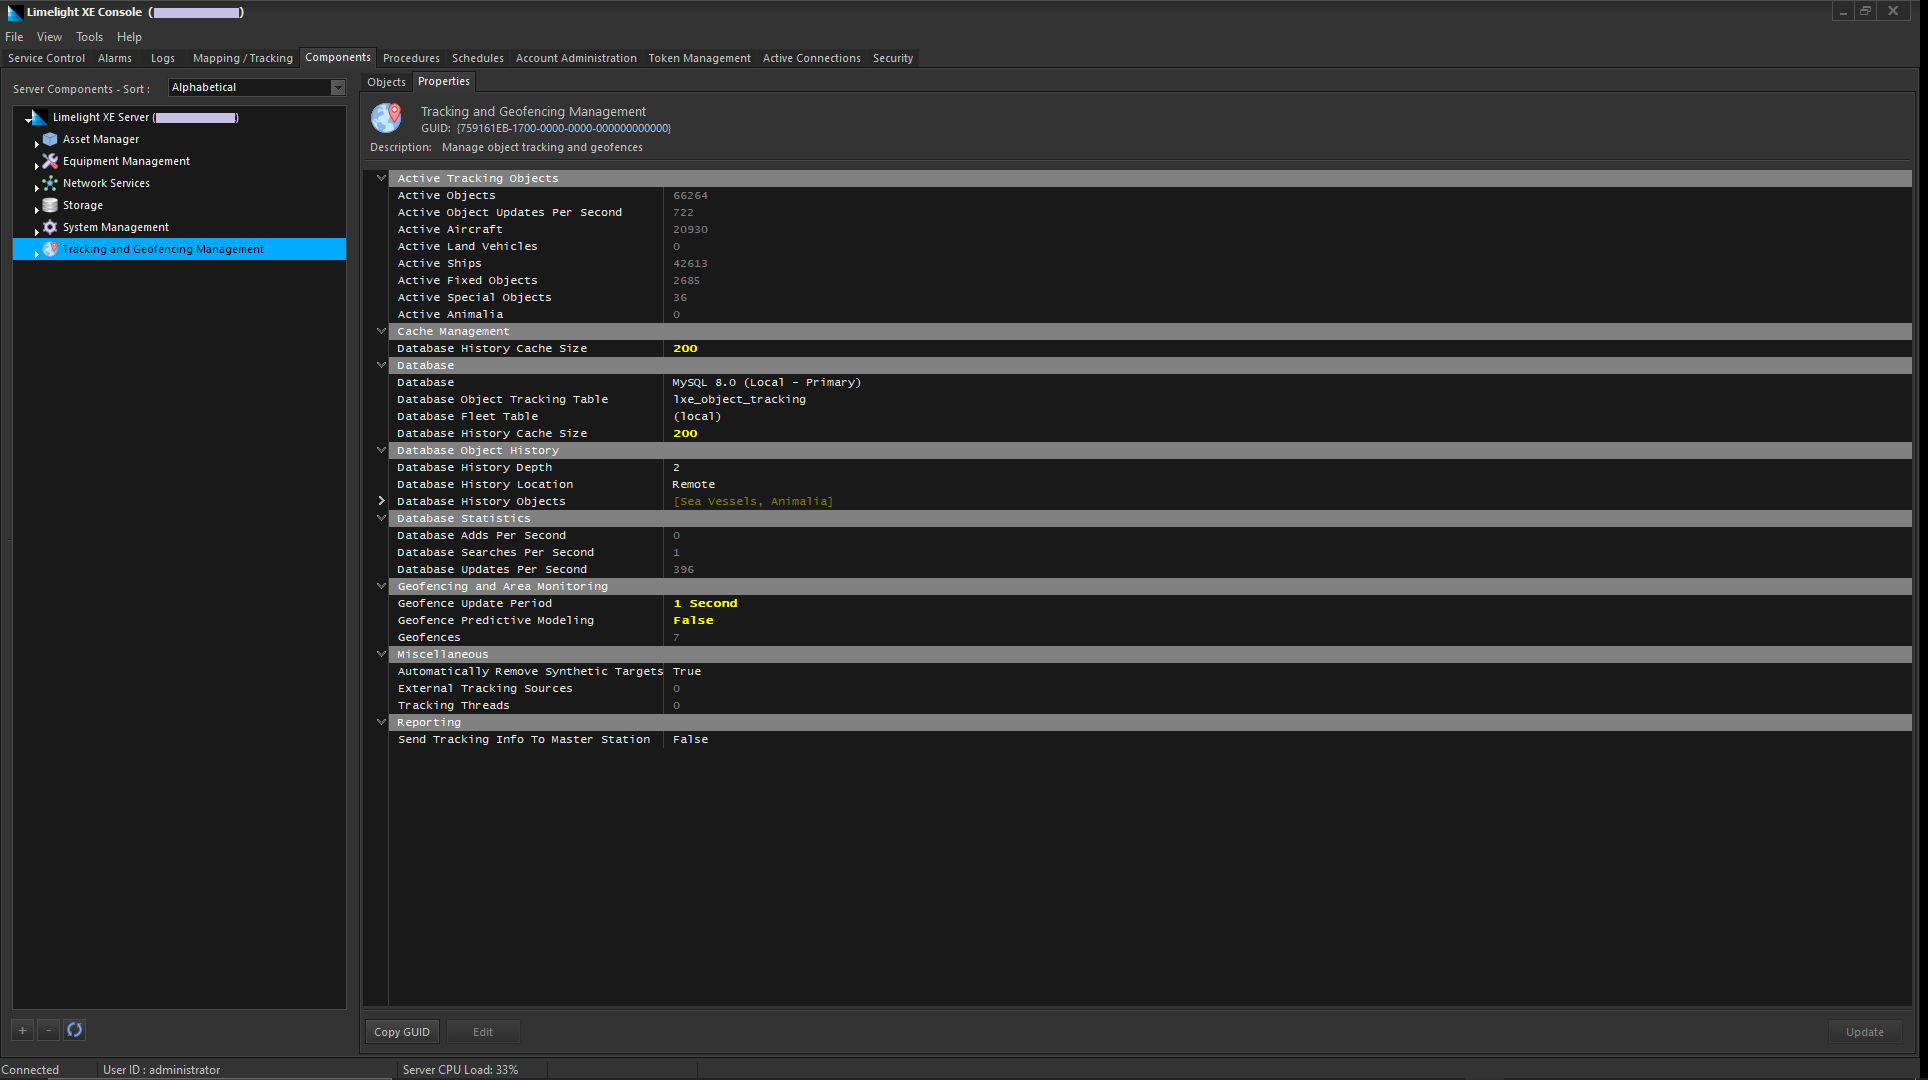
Components Tab
The Components Tab is a highly versatile tool where you can view a complete list of all components, objects, and their associated properties in the Limelight XE Console. This is also where you can find the script manager. To better understand the complete functionality of this tab please visit our documentation page:
We also recommend that you review this tutorial on scripting with the Limelight XE Console:
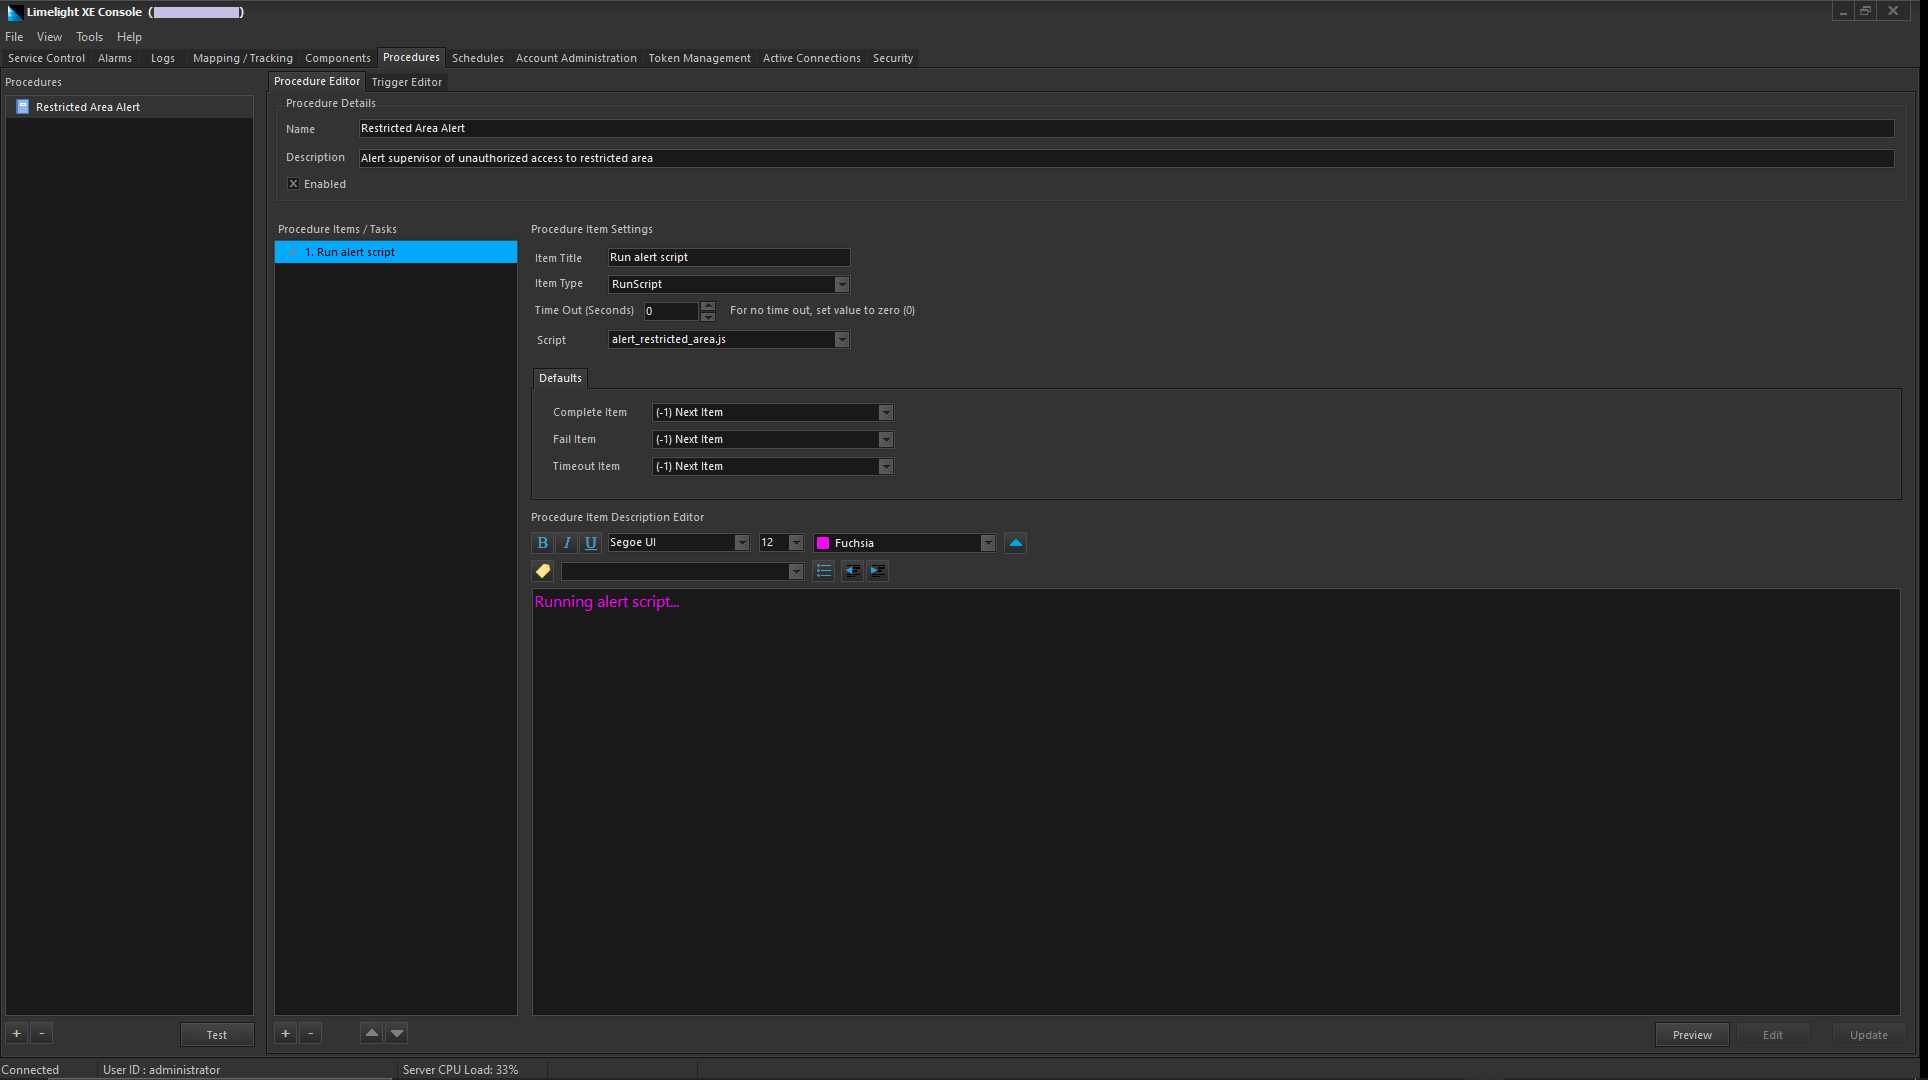
Procedures Tab
The Procedures Tab in the Limelight XE Console allows you to create, edit, and test alarm procedures. It can be broken up into two main components:
- Procedure List
- List of current procedures
- Create and delete procedures
- Test procedures
- Procedure Editor/Trigger Editor
- The procedure editor always you to create new items add existing items to a procedure as well as edit the details and description of the procedure.
- The Trigger Editor Tab allows you to view a list of procedures or schedules and add them to your procedure as a trigger.
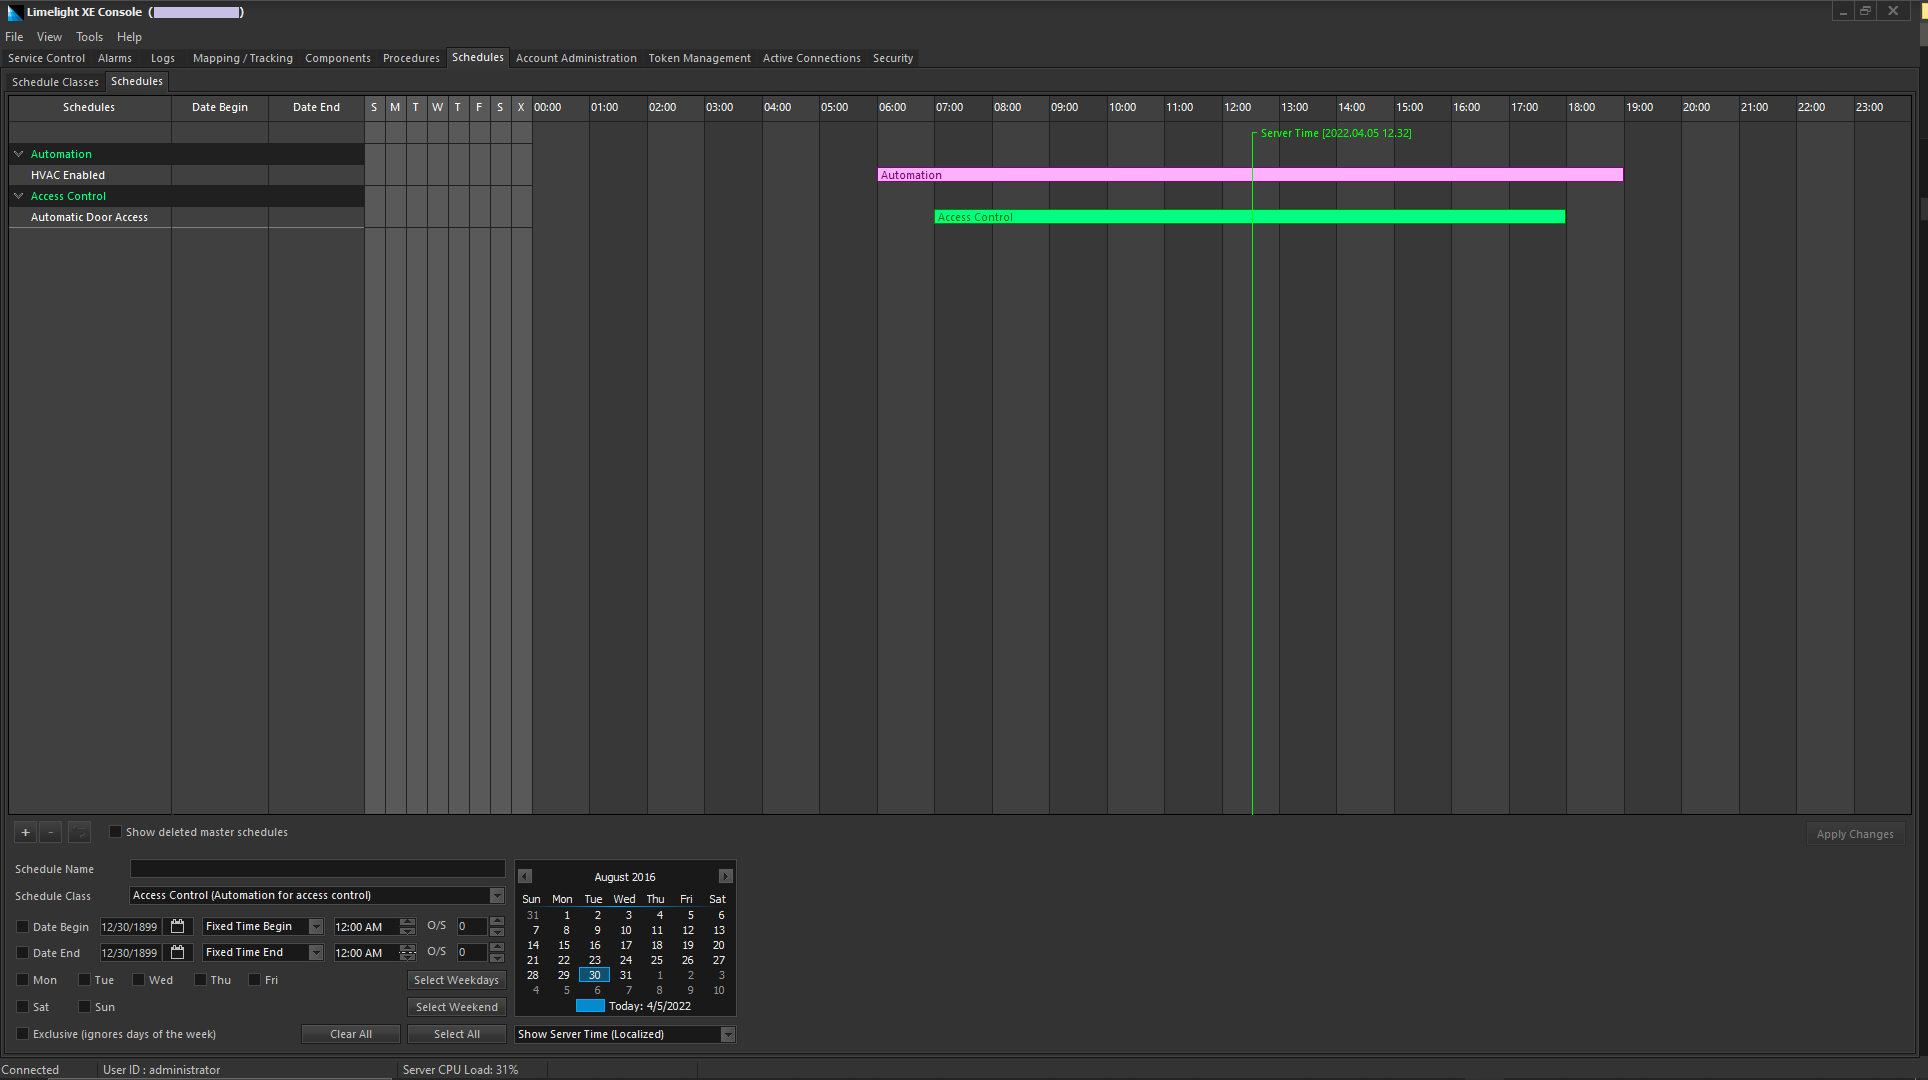
Schedules Tab
The Schedules Tab is a powerful and adaptive tool for viewing, creating, and managing your access schedules. It can ben broken down into two main components:
For an in-depth view of all the powerful features of this tab please visit the following links and tutorials:
- Schedule View
- View a list of current or upcoming schedules.
- View a list of existing schedule classes or create a new schedule class.
- Schedule Creator
- Create and edit new and existing schedules.
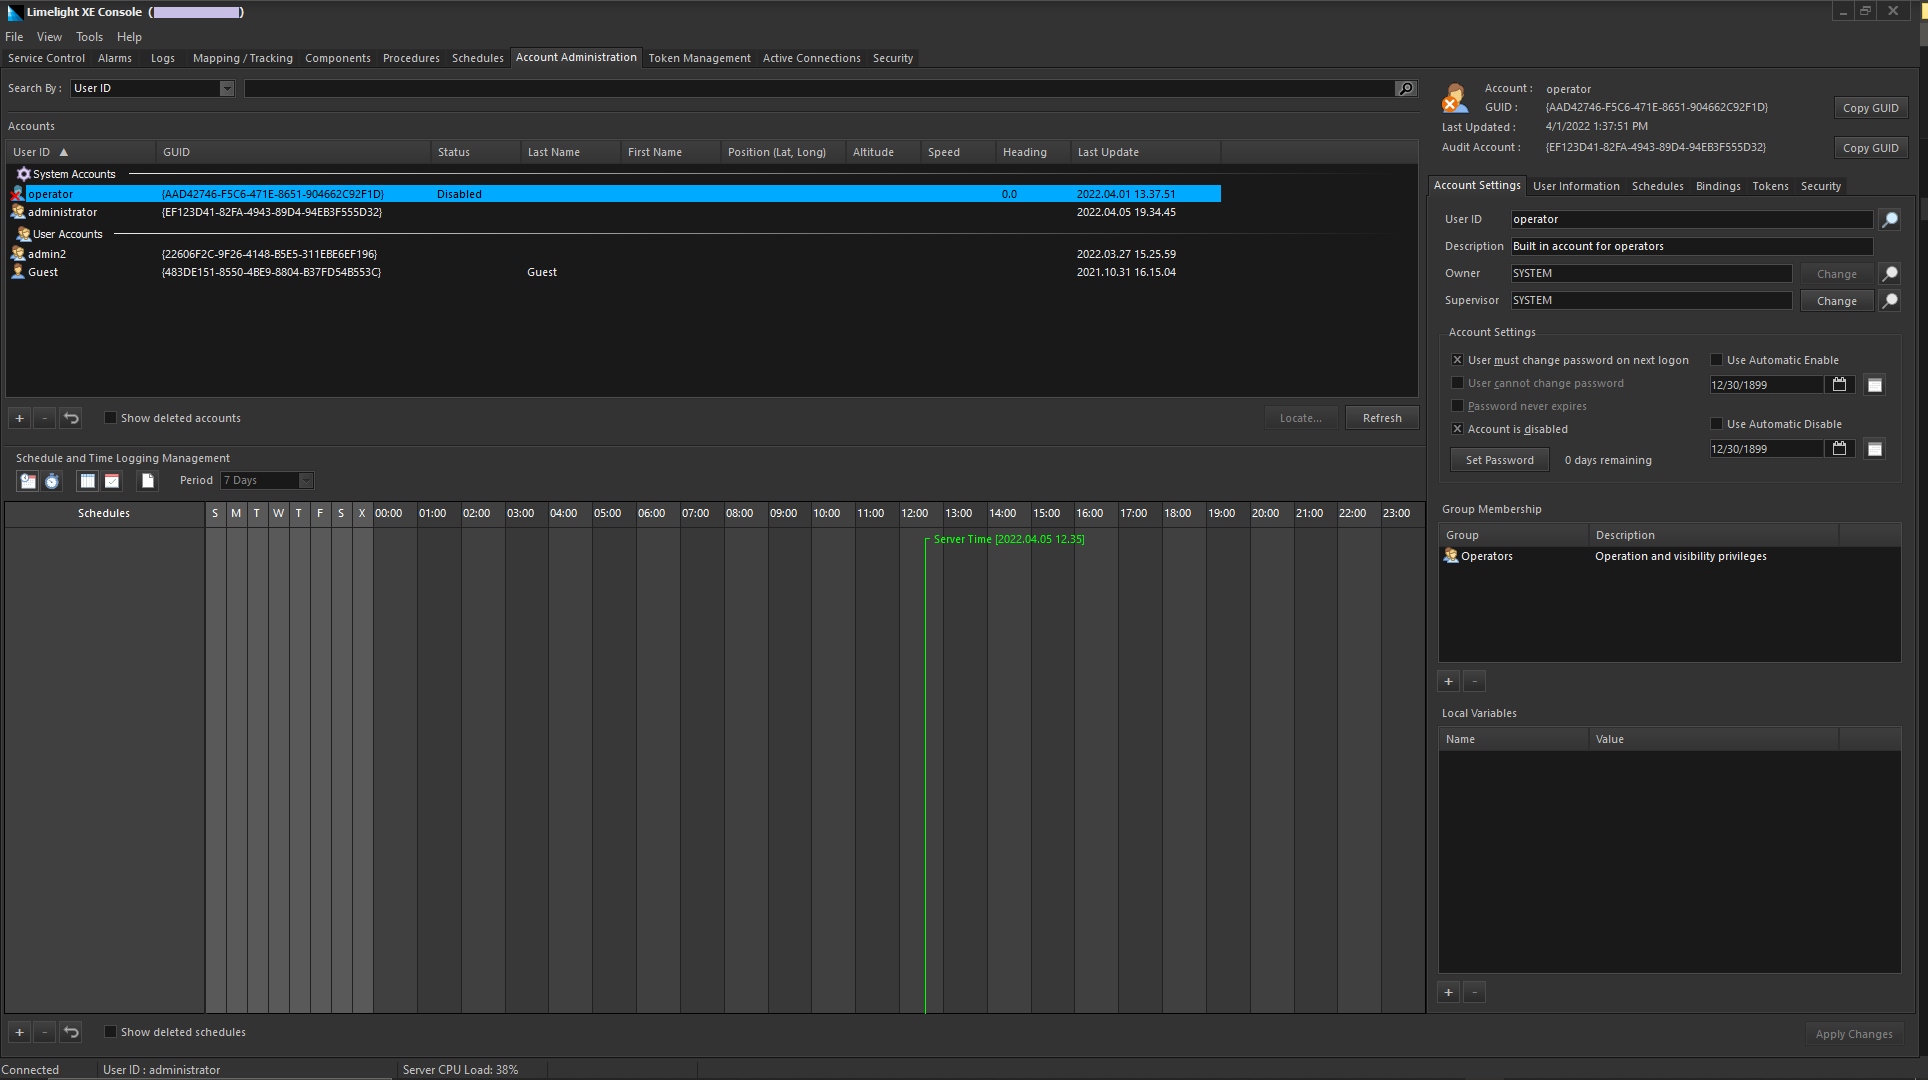
Account Administration Tab
The Account Administration Tab is your most versatile tool for creating new user accounts and assigning them to groups and schedules.
For a tutorial on creating new user accounts please visit this tutorial page:
The tab can be broken down into four main components:
- Accounts
- List of all current user accounts.
- Create and delete user accounts.
- View deleted user accounts.
- Schedules
- A linear view of any schedules associated with the selected user account.
- Account Details
- Account details associated with the selected user account.
- Group membership
- Add selected user account to a group.
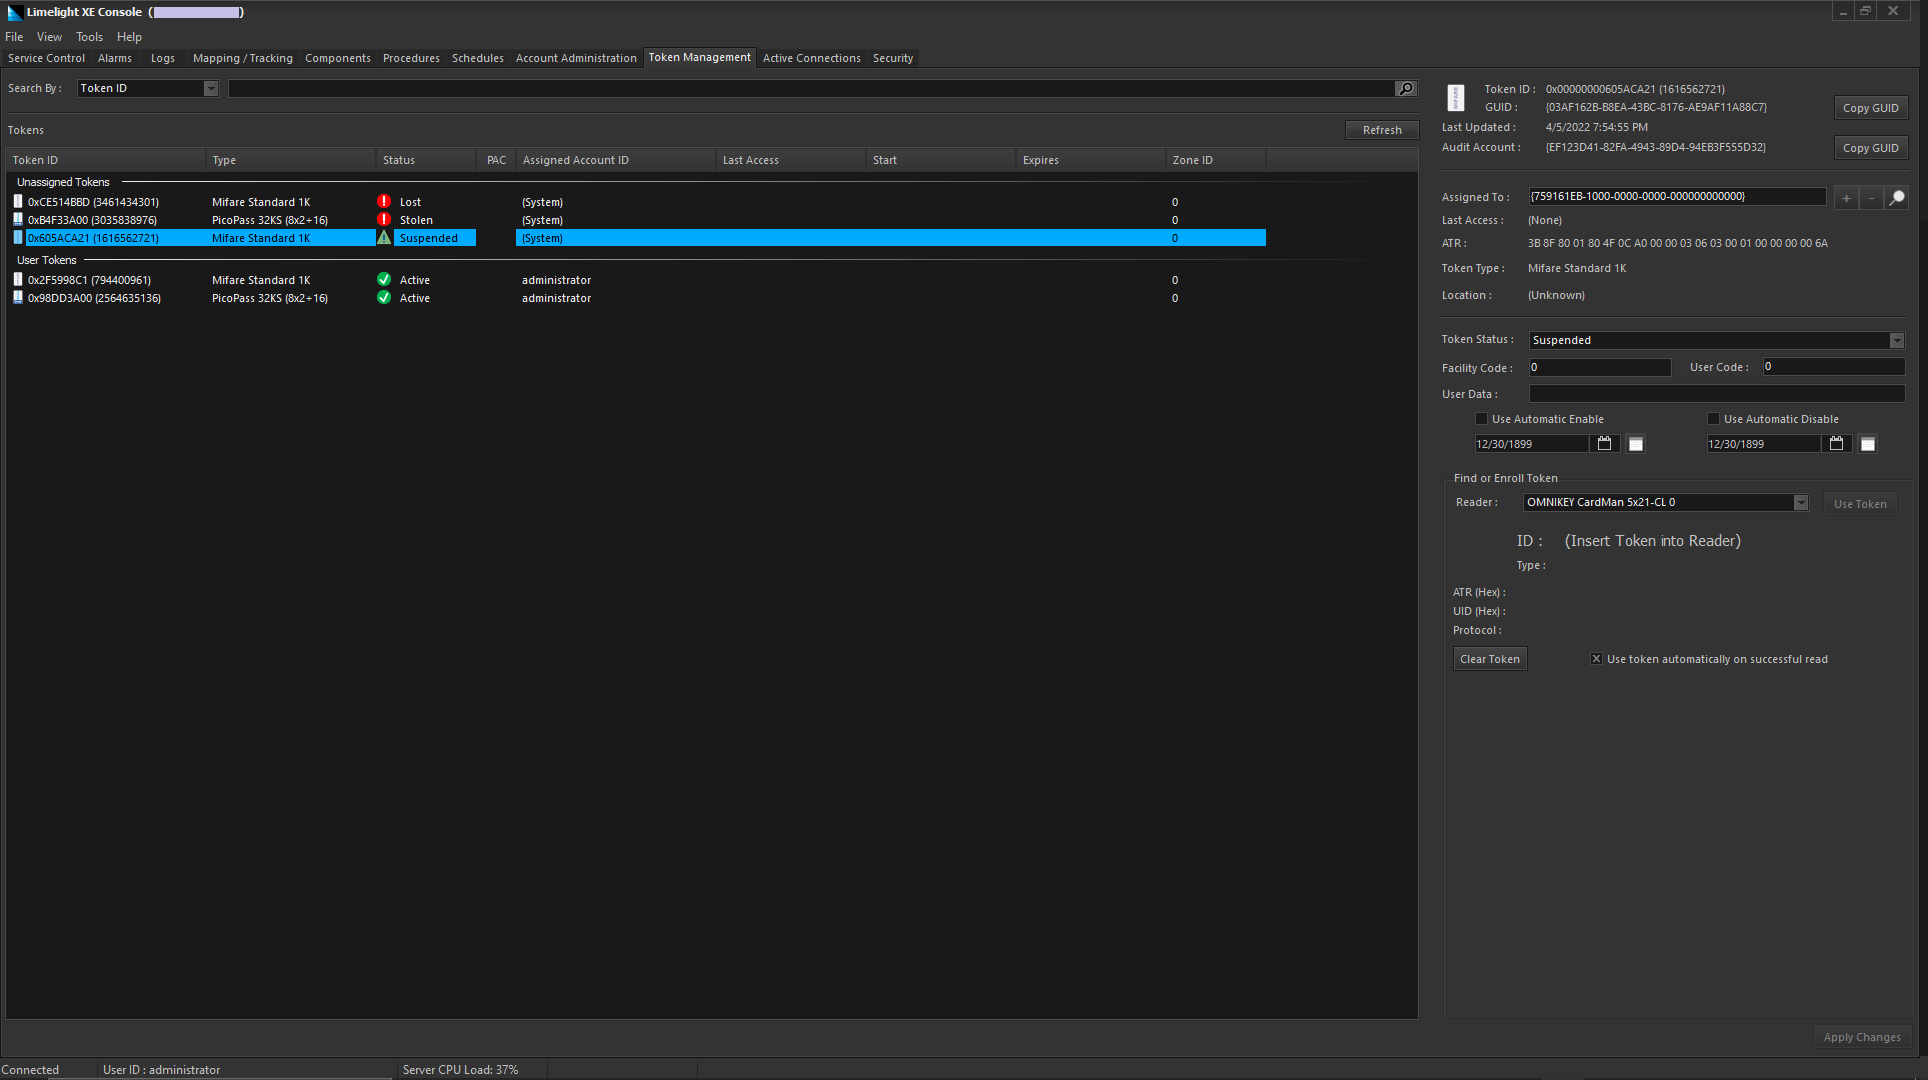
Token Management Tab
The Token Management Tab is where you can view a current list of security tokens and assign new ones. The tab can be broken down into three main components:
- Tokens
- View a list of security tokens, their type, status, and assigned account ID.
- Token Info
- View token ID, GUID, last updated timestamp, and audit account.
- Find or Enroll Token
Active Connections Tab
The Active Connections Tab is where you can view and manage active sessions and servers. It can be broken down into three main components:
- Active Application Sessions
- View or force close currently active application based sessions, their IP address, user, and session ID.
- Active HTML Sessions
- View or force close currently active HTML based sessions, their IP address, user, and session ID.
- Active Servers
- View a list of active servers and connect and locate new ones.

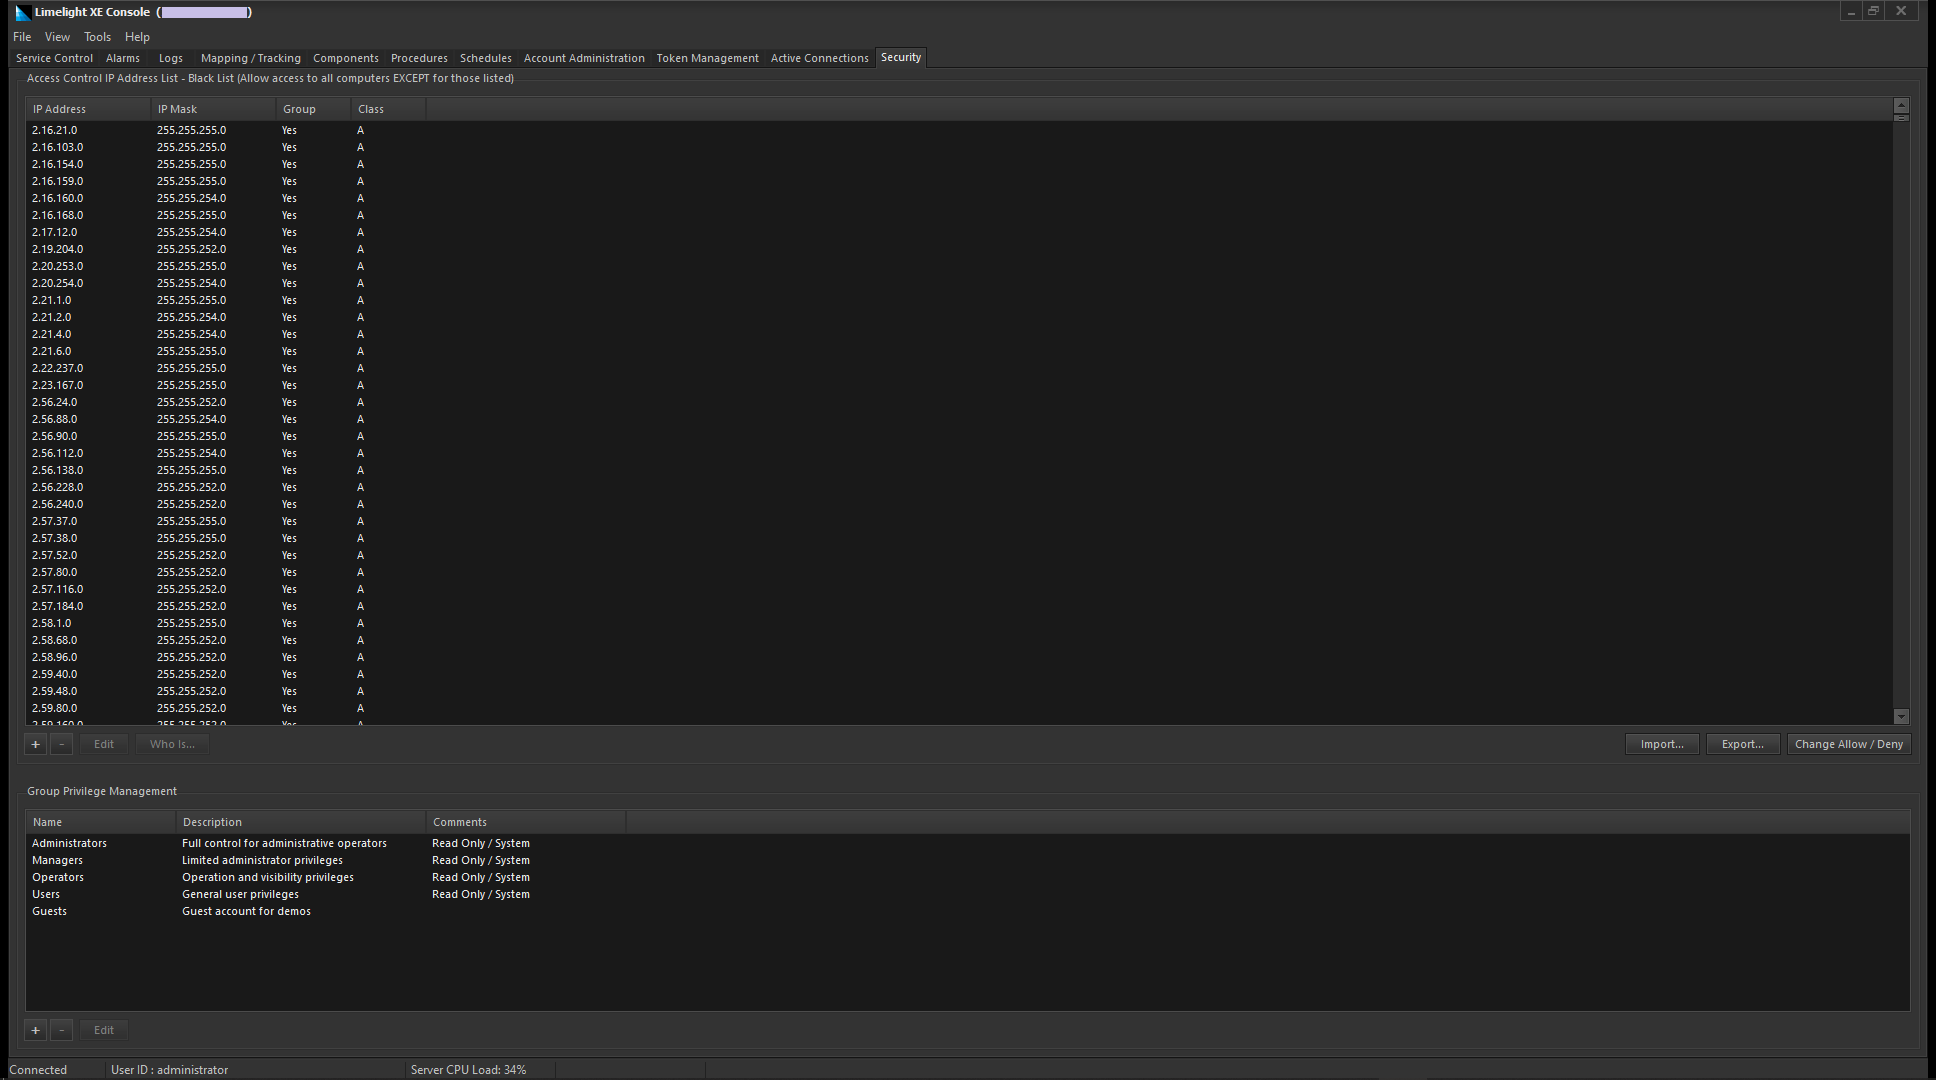
Security Tab
The Security Tab is where you can view and manage a list of IP addresses with access to the console. It can be broken down into two main components:
- Access Control List
- List of IP addresses that are excluded from access to the system.
- Export this list.
- Manage IP address on the list.
- Group Privilege Management
- Manage the privileges associated with the system groups.