
Overview
Command centers often require either localized or main (display wall) maps that show various geolocation data such as vehicles, people, weather as well as fixed objects and their status. In this tutorial we will create several different types of maps designed for tracking various objects as well as provide overlays with additional geo-data such as weather. We'll also provide a list of public and private tile map servers compatible with the Limelight Tile Mapping controls.
Prerequisites
- A working and registered Limelight XE™ installation including Limelight Interface Architect and Display Client (Version 2.2.11.1 or higher).
- A basic working knowledge of the Limelight XE™ architecture.
- A basic working knowledge of Limelight Interface Architect™.
Introduction
Limelight XE™ comes complete with a display engine and tools for creating highly graphical display walls and user interfaces. Limelight Interface Architect™ (LIA) is the design tool used to create display walls and user interface files which are read by the Limelight Display Client (LDC). LDC is a stand-alone display engine that drives these displays based on the design files created by LIA. See the Limelight Interface Architect™ documentation for a tutorial on this tool.
LIA files have the extension *.liadf or liadfb. These files define how the display components are configured and positioned on a particular display or monitor. For example, each control has a position (top, left) and a size (width, height) which is recorded in this file. While editing the display files with LIA, it will alter these values according to the positions relative to the target display (not necessarily to the display being used to create the design).
Start a New Design
Go to the Windows Start menu, scroll down to Limelight XE and select Limelight Interface Architect - this will launch the LIA tool. If you cannot find the tool, relaunch the installer and use the "Custom" option to make sure the tool is installed.
For mapping, we will use the mapping controls found on the right side of LIA under the Component Palette:
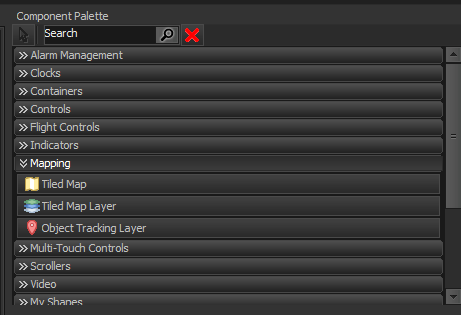
There are three (3) main mapping controls - Tiled Map (which holds the base map displayed in the background or Z=0), Tiled Map Layer (the various geo-data overlays) and Object Tracking Layer (usually the top layer showing objects to be tracked). All mapping controls are based on the Web Mercator Projection used by Google Maps, Open Street Maps, Geoapify and many other services for tiled web maps. Currently the Tiled Map and Tiled Map Overlay support raster tiles only (.png, .gif and .jpg formats). We have provided a reference section for some of these services for you to use. The Map Tile controls locally cache the maps to both speed up access and to off-load the tile servers (which is a nice thing to do especially for trial or free map tile services). The local caches can be found on the machine which displays the maps (i.e. where LIA or LDC is installed) in the local ProgramData\Strasis Systems\Limelight XE\cache directory. The Tiled Map and Tiled Map Layer controls use a hashing scheme to name the tiles based on the source (i.e. the tile server's URL) along with the tile zoom level and location (tile number) in the projection.
The Tile Map and Tile Map Layer controls use a special URL template that allows the control to substitute the correct reference information for the tile being requested. Below is a table (care of Open Street Maps) showing various templates. Both controls handle XYZ coordinates or Microsoft Bing Maps QuadKey tile number formats as well as multiple servers. The templates use curly brackets ( Left: {, right: } ) to define a parameter such as x, y, z or quadkey. When a range of servers is provided (.e.g. {a-c}) each request randomly selects which server will be used to balance the load on the tile server and provide better performance.
Example Map Tile Templates
| Name | URL template | Zoom Levels |
|---|---|---|
| OSM 'standard' style | https://{a-c}.tile.openstreetmap.org/{z}/{x}/{y}.png | 0-19 |
| Thunderforest Outdoors | https://tile.thunderforest.com/outdoors/{z}/{x}/{y}.png | 0-22 |
| Stamen Terrain | https://tile.stamen.com/terrain-background/{z}/{x}/{y}.jpg | 4-18 |
Create the Base Map
To create the base map simply select and drag the Tiled Map control from the palette to the monitor grid. If your system has multiple monitors, each will have a tab - so select which monitor to place the control (typically Display 1 which is the primary monitor). When you drop it on the monitor grid, it will automatically open the template "https://{a-c}.tile.openstreetmap.org/{z}/{x}/{y}.png" which is the OSM standard style map. Initially it may take a few seconds to load since it is establishing a secure connection with the osm tile server. After the connection is established, the loads are quite fast.
Next we need to locate and enlarge the map to see detail... select the Tiled Map control and drag it to the upper left Then mouse over the sizing boxes and make the map larger (alternatively you can set the width and height in the property editor on the right).
Tacking objects will appear above the base map, so for clarity the base map should be devoid of color. There are two options.
- Change the base map to a monochrome / darker style (e.g. Carto Dark Matter - see the tile server list for options)
- Set the Grayscale property to TRUE for the base map
For this tutorial we will simply turn on the Grayscale option in the property editor. You should now have the map below.
By default, base maps do not allow direct user interaction (e.g. mouse clicking, dragging, etc.). To make it easier to move the map to the area we are interested in, change the Allow Click property to TRUE and update the control. Now, when the map is live or in Preview Mode, you can drag the map around and zoom via the mouse wheel (similar to JavaScript Leaflet maps found in web browsers).
Press F2 to enter Preview Mode and drag the map to your center of interest (anywhere on the planet) - remember this is a Web Mercator Projection so the farther north or south you go, the larger the land masses appear. Since Strasis Systems is located in Orlando, FL we will center our map there and zoom to level 11. This is our view (see below).
Next, we need to add the Object Tracking Layer control to our map and configure it for our needs. On the Component Palette on the right, select the Object Tracking Layer control then click anywhere in the Tiled Map control (alternatively, you can drag the control to the map and drop it). Note the control is transparent, but it is visible in the Displays tree view on the left as a child of the Tiled Map control.
![]()
Next, we need to configure the classifiers to our needs. In this tutorial we will be connecting to a Limelight XE™ Server that have both the Display Manager plug-in and the ADS-B Ground Station drivers installed so we can track local aircraft broadcasting ADS-B positional information (which are most aircraft).
Since we only want to display aircraft, we need to turn off all the other classifiers so they are not displayed. To do this, make sure the Object Tracking Layer object is selected in the Displays tree view on the left (as shown above). Now expand each classifier in the Identity Group of the property editor (on lower right) as shown below.
Next, turn off all classifiers except the Classifier Air Vehicles by setting the Visible property to FALSE (remember to click UPDATE). Also, to make the aircraft easier to see on the light gray map, we will set the colors darker to make them more visible. See below
![]()
Next, save the design file to your local drive so it can act both as a back-up as well as a template for other displays. Click the File tab in the ribbon control at the top left and click Save or Save As, provide a file name (don't change the extension) and save it.
At this point, your tracking map is complete and ready to track aircraft. To test it, we must connect to the correct server which is actually "tracking" the objects and serving up the data. To connect to the remote (or local) Limelight XE™ Server, click the SERVERS tab, drop down the Connect drop down selector and select Connect (or Connect Local if the server is on the same machine). If you clicked Connect, you will see the full connection dialog which allows you to enter the IP address or name (domain name) of the remote server. Enter your user ID and password as well then click Connect.
![]()
The connection process may take a few seconds - Limelight Interface Architect™ will download all objects and other data from the connected server. The status bar on the bottom will indicate the download status. Once all the information about the server is downloaded, press F2 to preview the live tracking map. If the server is configured properly, the ADS-B receiver is providing the stream and aircraft are in the vicinity, you should see something like the map below. Click F2 again to return to editing mode. You can also see how the map will appear when loaded by the Limelight Display Client by pressing F11. This will take the design FULL SCREEN. Press F11 again to return to the normal editor mode.
Additional Object Tracking Information
Each classifier has additional display attributes that can be turned on or off.
- Display Accuracy Uncertainty - displays a circle around the object if the information has a high degree of uncertainty
- Display Category - adds additional information next to the object ID (top line). For aircraft, it adds the category based on weight and performance (e.g. (F-HY) indicates Fixed Wing / Heavy such as a B777). Note, many ADS-B transponders are programed with incorrect category information and may not be accurate.
- Display Range - this will display the range from the receiving station. If more than one station is reporting, it is the range of the closet station. Units of range are set in the Units Distance property and default to kilometers. The range data appears at the end of the third line (e.g. for kilometers it will indicate RK, for miles RM).
![]()
A close up of the active tracking map below shows these attributes turned on. Note, we reduced the glyph line width to 2 pixels to make them clearer on the map. This is a floating point number so even 1.5 pixels will work. Experiment with line widths and colors to tune your map for the best visibility - remember, less is more when it comes to user interfaces. Too much color or information can make it more difficult to make decisions.
![]()
Final Notes on Tracking Information
The tracking information is requested from the server based on the Update Rate (in seconds) in the Object Tracking Layer properties. Since most applications will require real-time tracking, this can be adjusted based on how fast the data is being cycled in the database. For an enterprise deployment, using an external database enables you to push your own tracking information into the object tracking table as long as it meets the requirements of the object tracking table schema. This is a very powerful capability and allows integration of tracking maps into existing systems.
To reduce bandwidth, the server only pushes changes in position to the mapping control during each update cycle. It is recommended to reduce load on the database engine (e.g. MSSQL or MySQL) as well as the Limelight XE™ Server to set the update period within the limits of the particular objects being tracked. For instance, if you are tracking cattle, the update rate could be set to 60 seconds which would be quite adequate to keep tabs on your herd. Tags on cattle may only update once every 5 minutes to conserve battery life, however, not all tags are reporting at the same time so 60 seconds provides a reasonable update period even for this application.
Deploying Maps to Display Walls
In the next section we will cover how to put your map on the "big screen" to display your tracking data... click the NEXT CHAPTER link below to begin.