The tables below provide various free and commercial tile servers (attribution provided in the table) as of 6/8/2025. If there is an issue with a URL template (i.e. the tile server link), please contact us. To use in the Limelight Interface Architect™ Tiled Map and Tiled Map Overlay controls, copy and paste the URL template below (as is) into the "Tile Server" property. If an API key is required, enter your key in the "API Key" property.
The tables are broken into two sections - the first is for the Tiled Map control which forms the base map that all overlays sit above. The second is for the Tiled Map Overlay which sits in layers above the base layer map. The overlay maps are typically PNG or GIF format which allows for transparency which can be adjusted in the Tile Map Overlay "Alpha Level" property (defaults to 128 which is 1/2 transparent).
To add a map overlay to a base map, select the Tiled Map Overlay control from the Limelight Interface Architect™ control palette and drag and drop it on top of the Tiled Map base map control. You can then select it from the Displays treeview on the left to change any of the properties including the tile server URL. Also, while designing, you can right mouse click over the group of controls to set the Z-Order which determines the display order of the layers. By default, they display in the order they are created. See the Limelight Interface Architect™ documentation for more information on designing with maps as well as our tutorials.
Base Maps (Use with the Tiled Map control)
| Name (Attribution) | URL Template | Requires API key |
Example |
|---|---|---|---|
| Open Street Map |
https://{a-c}.tile.openstreetmap.org/{z}/{x}/{y}.png |
NO |  |
| Google Road |
https://mt1.google.com/vt/lyrs=m&x={x}&y={y}&z={z} |
NO |  |
| Google Road (High Contrast) |
https://mt1.google.com/vt/lyrs=h&x={x}&y={y}&z={z} |
NO |  |
| Google Hybrid |
https://mt1.google.com/vt/lyrs=y&x={x}&y={y}&z={z} |
NO | 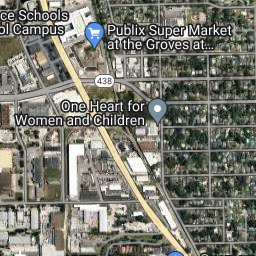 |
| Google Satellite |
https://mt1.google.com/vt/lyrs=s&x={x}&y={y}&z={z} |
NO | 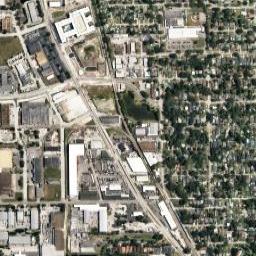 |
| Open Topographic Map | https://{s}.tile.opentopomap.org/{z}/{x}/{y}.png | NO |  |
| USGS Imagery | https://basemap.nationalmap.gov/arcgis/rest/services/USGSImageryOnly/MapServer/tile/{Z}/{Y}/{X} | NO |  |
| USGS Topographical Map | https://basemap.nationalmap.gov/arcgis/rest/services/USGSTopo/MapServer/tile/{Z}/{Y}/{X} | NO | 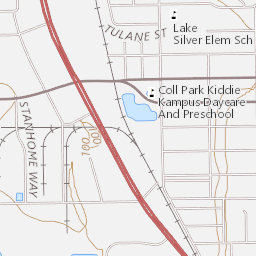 |
| Maps for Free - Relief Map | https://maps-for-free.com/layer/relief/z{z}/row{y}/{z}_{x}-{y}.jpg (Note: Maximum zoom level is 12) |
NO |  |
| NASA Earthdata Imagery | https://gibs.earthdata.nasa.gov/wmts/epsg4326/best/BlueMarble_ShadedRelief_Bathymetry/default//EPSG4326_500m/{z}/{y}/{x}.jpeg (Note: maximum zoom level is 8) |
NO |  |
| ArcGIS Online Maps | |||
| World Street Map | https://server.arcgisonline.com/ArcGIS/rest/services/World_Street_Map/MapServer/tile/{z}/{y}/{x}.jpg | NO | 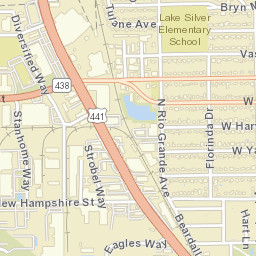 |
| National Geographic World Map | https://server.arcgisonline.com/ArcGIS/rest/services/NatGeo_World_Map/MapServer/tile/{z}/{y}/{x}.jpg | NO | 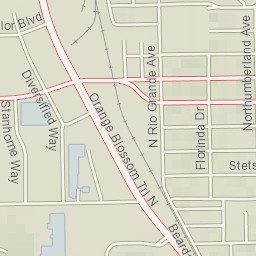 |
| Light Gray Base Map with Labels | https://server.arcgisonline.com/ArcGIS/rest/services/Canvas/World_Light_Gray_Base/MapServer/tile/{z}/{y}/{x}.jpg | NO |  |
| Dark Gray Base Map with Labels | https://server.arcgisonline.com/ArcGIS/rest/services/Canvas/World_Dark_Gray_Base/MapServer/tile/{z}/{y}/{x}.jpg | NO |  |
| World Imagery | https://server.arcgisonline.com/ArcGIS/rest/services/World_Imagery/MapServer/tile/{z}/{y}/{x}.jpg | NO | 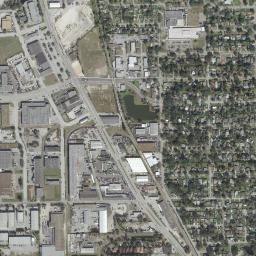 |
| World Imagery (Firefly) |
https://fly.maptiles.arcgis.com/arcgis/rest/services/World_Imagery_Firefly/MapServer/Tile/{z}/{y}/{x}.jpg Note: low zoom levels have less color saturation allowing for brighter overlay layers to be clearer and not compete with the base map layer. |
NO |  |
| World Topographic Map | https://server.arcgisonline.com/ArcGIS/rest/services/World_Topo_Map/MapServer/tile/{z}/{y}/{x}.jpg | NO | 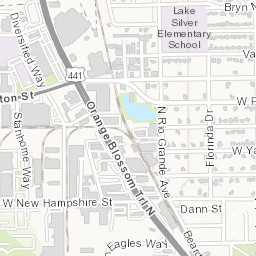 |
| World Terrain Base | https://server.arcgisonline.com/ArcGIS/rest/services/World_Terrain_Base/MapServer/tile/{z}/{y}/{x}.jpg | NO |  |
| World Ocean Base | https://server.arcgisonline.com/ArcGIS/rest/services/Ocean/World_Ocean_Base/MapServer/tile/{z}/{y}/{x}.jpg | NO |  |
| Wikimedia Map | https://maps.wikimedia.org/osm/{z}/{x}/{y}.png | NO |  |
| Carto Base Maps | (Excellent base maps for data / tracking overlays) | ||
| Voyager with Labels | https://{s}.basemaps.cartocdn.com/rastertiles/voyager_labels_under/{z}/{x}/{y}.png | NO | 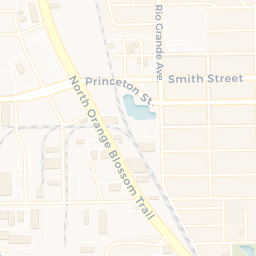 |
| Voyager without Labels | https://{s}.basemaps.cartocdn.com/rastertiles/voyager_nolabels/{z}/{x}/{y}.png | NO | 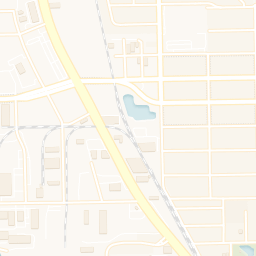 |
| Positron with Lables | https://{s}.basemaps.cartocdn.com/rastertiles/light_all/{z}/{x}/{y}.png | NO | 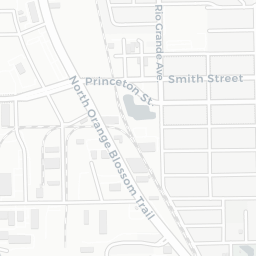 |
| Positron without Lables | https://{s}.basemaps.cartocdn.com/rastertiles/light_nolabels/{z}/{x}/{y}.png | NO |  |
| Dark Matter with Labels | https://{s}.basemaps.cartocdn.com/rastertiles/dark_all/{z}/{x}/{y}.png | NO |  |
| Dark Matter without Labels | https://{s}.basemaps.cartocdn.com/rastertiles/dark_nolabels/{z}/{x}/{y}.png | NO |  |
| Thunderforest Maps | (Free API Key available for up to 150,000 tile requests per month) | ||
| Open Cycle Map | https://tile.thunderforest.com/cycle/{z}/{x}/{y}.png | YES |  |
| Transport | https://tile.thunderforest.com/transport/{z}/{x}/{y}.png | YES | |
| Landscape | https://tile.thunderforest.com/landscape/{z}/{x}/{y}.png | YES | 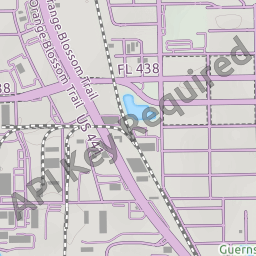 |
| Outdoors | https://tile.thunderforest.com/outdoors/{z}/{x}/{y}.png | YES |  |
| Atlas | https://tile.thunderforest.com/atlas/{z}/{x}/{y}.png | YES |  |
| Spinal Map | https://tile.thunderforest.com/spinal-map/{z}/{x}/{y}.png | YES |  |
| Geoapify Base Maps | (Nice collection of base maps - requires API key, but free for testing or simple projects) | ||
| OSM Carto | https://maps.geoapify.com/v1/tile/osm-carto/{z}/{x}/{y}.png | YES |  |
| Dark Matter | https://maps.geoapify.com/v1/tile/dark-matter/{z}/{x}/{y}.png | YES |  |
| Dark Matter Brown | https://maps.geoapify.com/v1/tile/dark-matter-brown/{z}/{x}/{y}.png | YES |  |
| Dark Matter Dark Grey | https://maps.geoapify.com/v1/tile/dark-matter-dark-grey/{z}/{x}/{y}.png | YES |  |
| Dark Matter Dark Purple | https://maps.geoapify.com/v1/tile/dark-matter-dark-purple/{z}/{x}/{y}.png | YES |  |
| Dark Matter Purple Roads | https://maps.geoapify.com/v1/tile/dark-matter-purple-roads/{z}/{x}/{y}.png | YES | 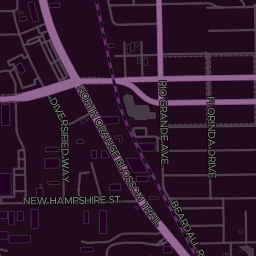 |
| Dark Matter Yellow Roads | https://maps.geoapify.com/v1/tile/dark-matter-yellow-roads/{z}/{x}/{y}.png | YES | 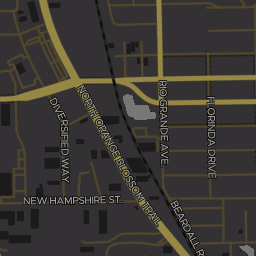 |
| Klokantech Basic | https://maps.geoapify.com/v1/tile/klokantech-basic/{z}/{x}/{y}.png | YES | 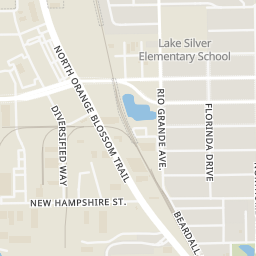 |
| Maptiler 3D | https://maps.geoapify.com/v1/tile/maptiler-3d/{z}/{x}/{y}.png | YES | 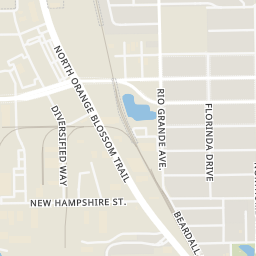 |
| OSM Bright | https://maps.geoapify.com/v1/tile/osm-bright/{z}/{x}/{y}.png | YES |  |
| OSM Bright Grey | https://maps.geoapify.com/v1/tile/osm-bright-grey/{z}/{x}/{y}.png | YES | 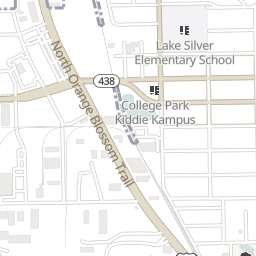 |
| OSM Bright Smooth | https://maps.geoapify.com/v1/tile/osm-bright-smooth/{z}/{x}/{y}.png | YES |  |
| OSM Liberty | https://maps.geoapify.com/v1/tile/osm-liberty/{z}/{x}/{y}.png | YES |  |
| Positron | https://maps.geoapify.com/v1/tile/positron/{z}/{x}/{y}.png | YES |  |
| Positron Blue | https://maps.geoapify.com/v1/tile/positron-blue/{z}/{x}/{y}.png | YES |  |
| Positron Red | https://maps.geoapify.com/v1/tile/positron-red/{z}/{x}/{y}.png | YES | 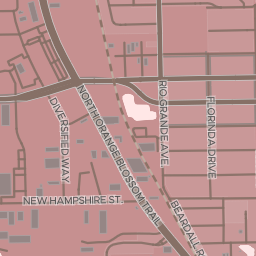 |
| Toner | https://maps.geoapify.com/v1/tile/toner/{z}/{x}/{y}.png | YES |  |
| Toner Grey | https://maps.geoapify.com/v1/tile/toner-grey/{z}/{x}/{y}.png | YES | 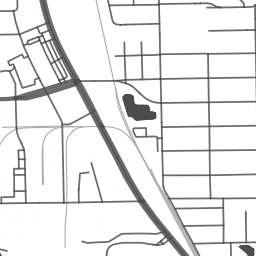 |
Overlays (Use with the Tiled Map Overlay control)
This overlay from Google provides only road and points of interest which when used in conjunction with a Satellite base map provides enhanced situational awareness along with the ability to turn off the road information when viewing detailed imagery.
| Name (Attribution) | URL Template | Requires API key |
Example |
|---|---|---|---|
| National Weather Service | (various GeoJSON links for hurricane and tropical storm forecasts and tracking) | ||
|
In Limelight XE the image on the right includes the current storm position, the predication track, warnings and watches along with the storm prediction cone. All data is provided as GeoJSON, so when configuring in Limelight XE, create new GeoJSON Layers and use the links below. Storm Position See the full explanation on how to set this up here. |
NO | ||
| Iowa State University Meteorlogical Data Tile Server | (Extensive set of real-time weather data tiles - Click on an example image below for a larger view) | ||
| ISU - NEXTRAD Base Reflectivity (current) | https://mesonet.agron.iastate.edu/cache/tile.py/1.0.0/nexrad-n0q-900913/{z}/{x}/{y}.png (note: base map in the example is ArcGIS Dark Gray - see above) |
NO |  |
| ISU - NEXTRAD Echo Tops EET (current) | https://mesonet.agron.iastate.edu/cache/tile.py/1.0.0/nexrad-eet-900913/{z}/{x}/{y}.png (note: base map in the example is ArcGIS Dark Gray - see above) |
NO | 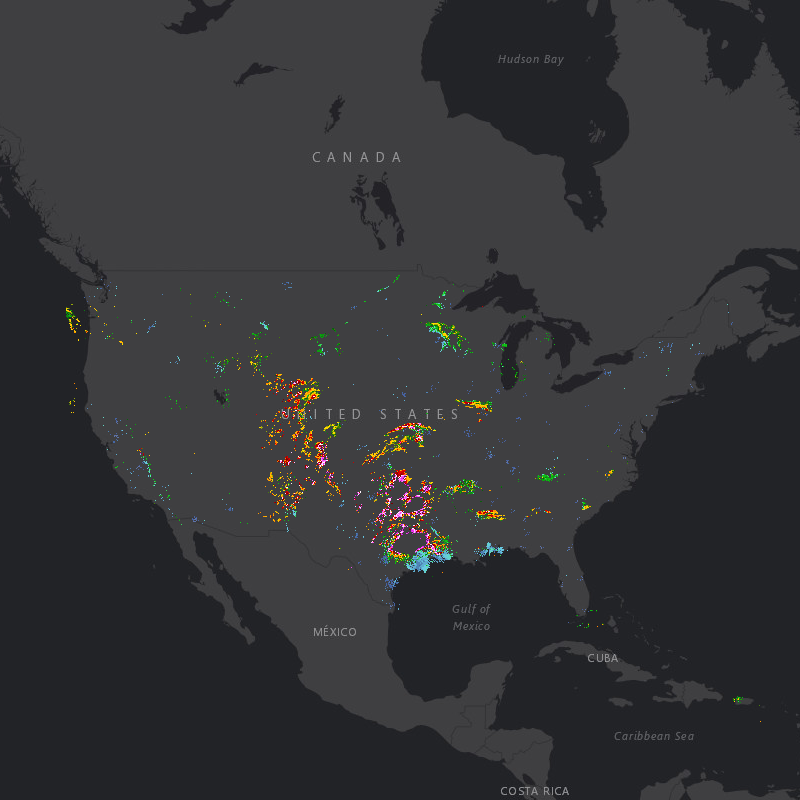 |
| ISU - 1 Hour Precipitation | https://mesonet.agron.iastate.edu/cache/tile.py/1.0.0/q2-n1p-900913/{z}/{x}/{y}.png (note: base map in the example is ArcGIS Dark Gray, additional overlay is reference on top of rainfall - see above and below) |
NO |  |
| ISU - 24 Hour Precipitation | http://mesonet.agron.iastate.edu/cache/tile.py/1.0.0/q2-p24h-900913/{z}/{x}/{y}.png (note: base map in the example is ArcGIS Dark Gray, additional overlay is reference on top of rainfall - see above and below) |
NO |  |
| ISU - 48 Hour Precipitation | https://mesonet.agron.iastate.edu/cache/tile.py/1.0.0/q2-p48h-900913/{z}/{x}/{y}.png (note: base map in the example is ArcGIS Dark Gray, additional overlay is reference on top of rainfall - see above and below) |
NO |  |
| ISU - 72 Hour Precipitation | http://mesonet.agron.iastate.edu/cache/tile.py/1.0.0/q2-p72h-900913/{z}/{x}/{y}.png (note: base map in the example is ArcGIS Dark Gray, additional overlay is reference on top of rainfall - see above and below) |
NO |  |
| ISU - MRMS Hybrid-Scan Reflectivity Composite | https://mesonet.agron.iastate.edu/cache/tile.py/1.0.0/q2-hsr-900913/{z}/{x}/{y}.png (note: base map in the example is ArcGIS Dark Gray, additional overlay is reference on top of radar image - see above and below) |
NO |  |
| ISU - GEOS Satellite IR Image | https://mesonet.agron.iastate.edu/cache/tile.py/1.0.0/goes-ir-4km-900913/{z}/{x}/{y}.png (note: base map in the example is ArcGIS Dark Gray, additional overlay is reference on top of radar image - see above and below) |
NO |  |
| ISU - GEOS Satellite Images | https://mesonet.agron.iastate.edu/cache/tile.py/1.0.0/goes_east_conus_ch01/{z}/{x}/{y}.png (note: base map in the example is ArcGIS Dark Gray, additional overlay is reference on top of satellite image - see above and below). You can modify the "goes_east_conus_ch01" section with the form "goes_yyyy_conus_chxx" where yyyy="east" (as above) or "west" to select the satellite, xx="01" through "16" for the channel. For example, https://mesonet.agron.iastate.edu/cache/tile.py/1.0.0/goes_west_conus_ch15/{z}/{x}/{y}.png selects the west satellite and channel 15.See GOES Satellite Imagery for more information. |
NO |  |
| Google Roads | https://mt1.google.com/vt/lyrs=h&x={x}&y={y}&z={z} This overlay from Google provides only road and points of interest information without the base map. This is useful when using satellite imagery and want the ability to overlay road information to enhance situational awareness. When using this overlay it also allows the user to switch it on and off when viewing details. |
NO | 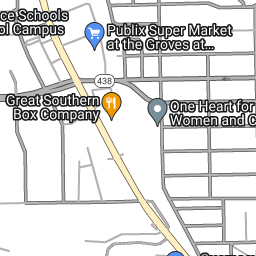 |
| Bing Traffic Overlay | http://trafficrenderer-prod.trafficmanager.net/comp/ch/{quadkey}.png (note: base map in the example is Cardo Dark Matter with Labels - see above) |
NO | 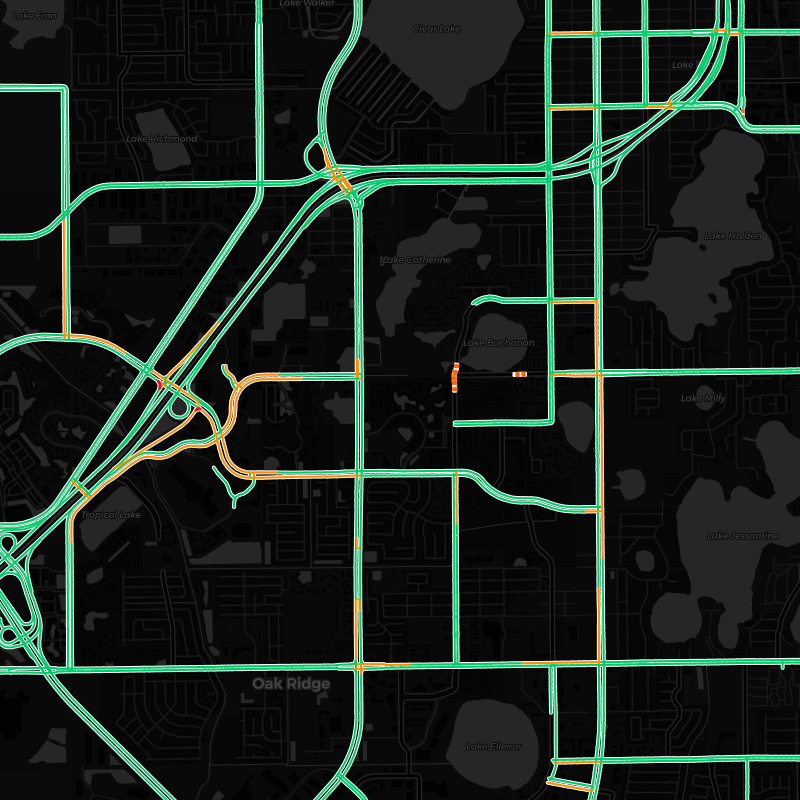 |
| Open Railway Maps | (Great collection of railroad infrastructure and associated geo-data for overlaying maps) | ||
| Open Railway Overlay - Track Infrastructure | https://{a-c}.tiles.openrailwaymap.org/standard/{z}/{x}/{y}.png | NO | 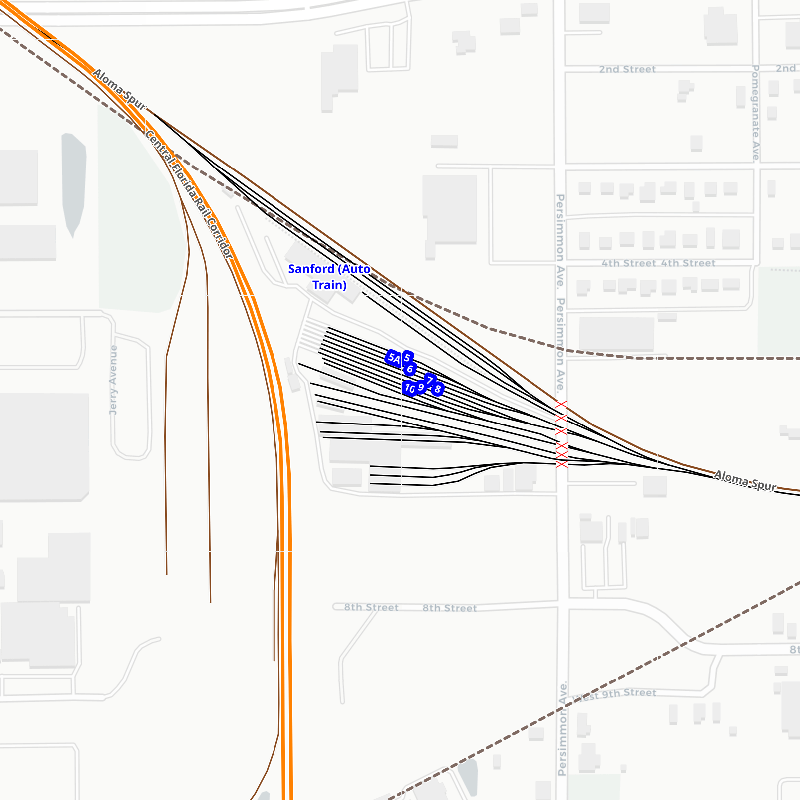 |
| Open Railway Overlay - Maximum Speed | https://{a-c}.tiles.openrailwaymap.org/maxspeed/{z}/{x}/{y}.png | NO |  |
| Open Railway Overlay - Electrification | https://{a-c}.tiles.openrailwaymap.org/electrification/{z}/{x}/{y}.png | NO |  |
| Open Railway Overlay - Signals | https://{a-c}.tiles.openrailwaymap.org/signals/{z}/{x}/{y}.png | NO | 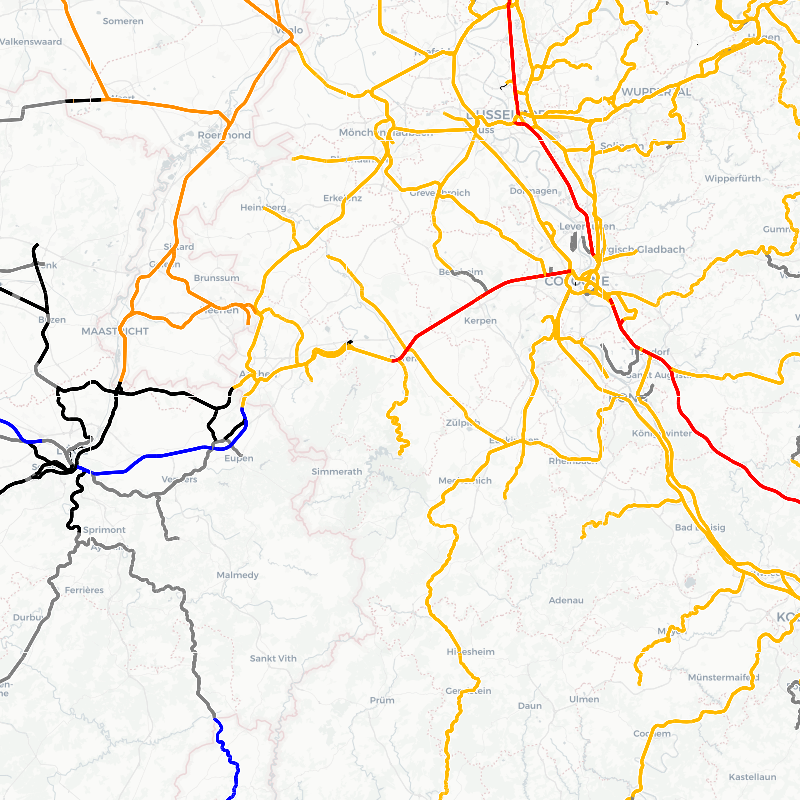 |
| Maps For Free Project | (Excellent collection of map overlays showing various geo-data) | ||
| Administrated Area Overlay | https://maps-for-free.com/layer/admin/z{z}/row{y}/{z}_{x}-{y}.gif | NO |  |
| Crops Overlay | https://maps-for-free.com/layer/crop/z{z}/row{y}/{z}_{x}-{y}.gif | NO |  |
| Forest Overlay | https://maps-for-free.com/layer/forest/z{z}/row{y}/{z}_{x}-{y}.gif | NO | 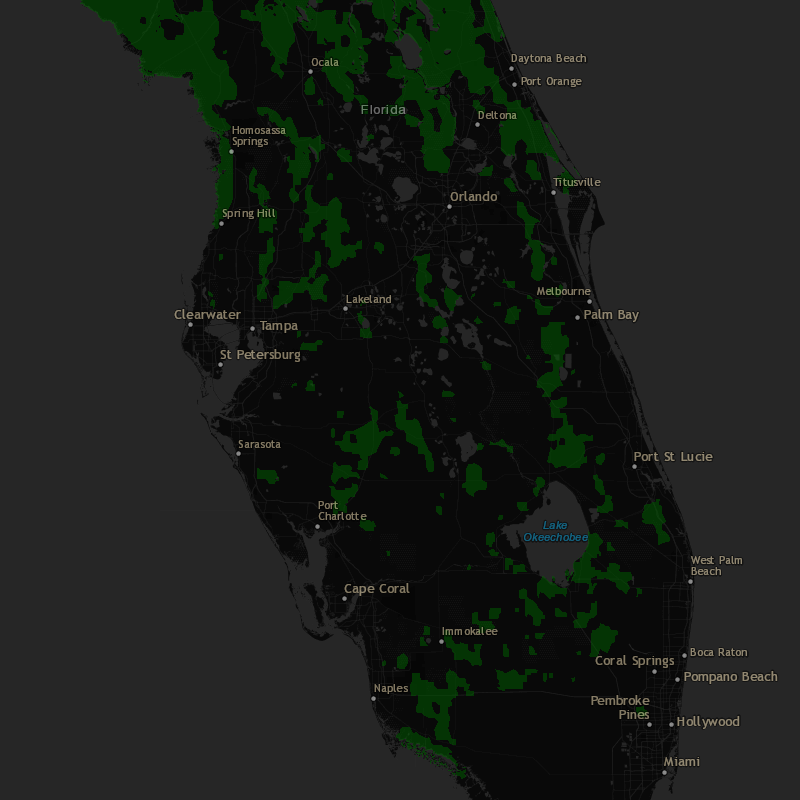 |
| Grass Overlay | https://maps-for-free.com/layer/grass/z{z}/row{y}/{z}_{x}-{y}.gif | NO |  |
| Ice Overlay | https://maps-for-free.com/layer/ice/z{z}/row{y}/{z}_{x}-{y}.gif | NO |  |
| Sand Overlay | https://maps-for-free.com/layer/sand/z{z}/row{y}/{z}_{x}-{y}.gif | NO | 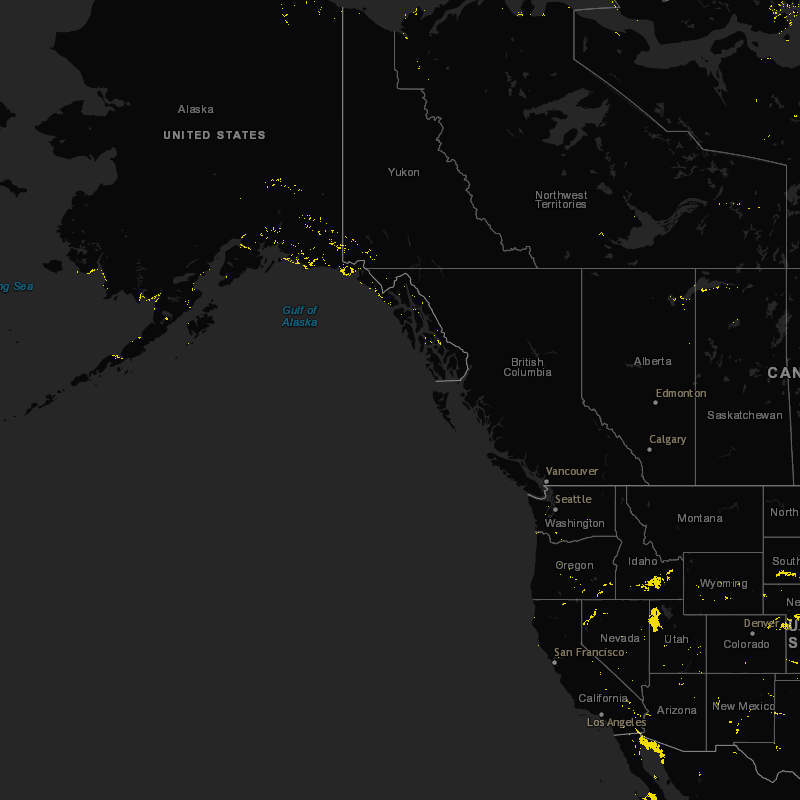 |
| Streets Overlay | https://maps-for-free.com/layer/streets/z{z}/row{y}/{z}_{x}-{y}.gif | NO |  |
| Swamp Overlay | https://maps-for-free.com/layer/swamp/z{z}/row{y}/{z}_{x}-{y}.gif | NO | 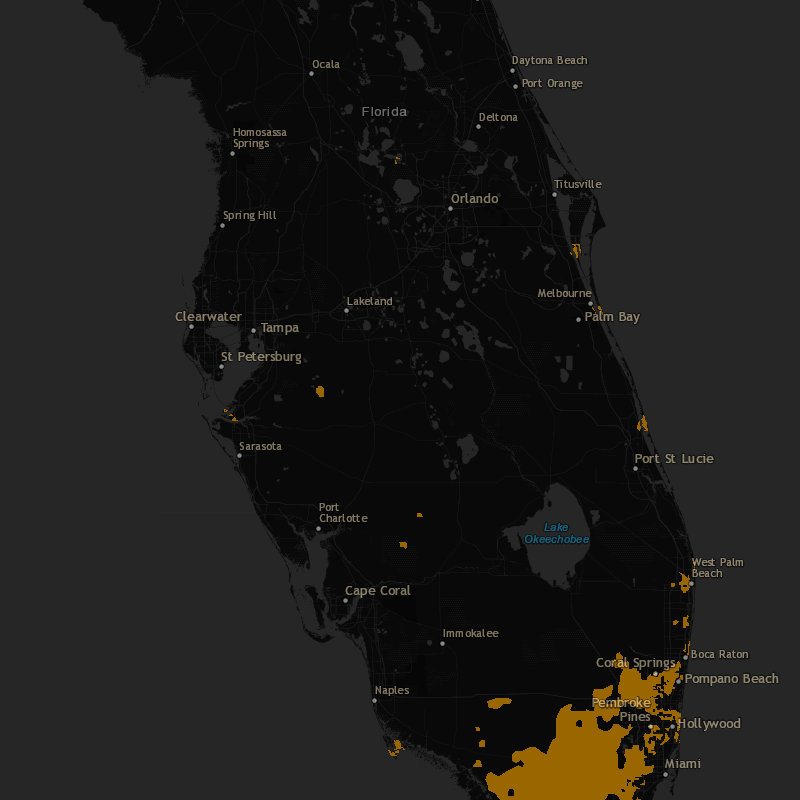 |
| Tundra Overlay | https://maps-for-free.com/layer/tundra/z{z}/row{y}/{z}_{x}-{y}.gif | NO | 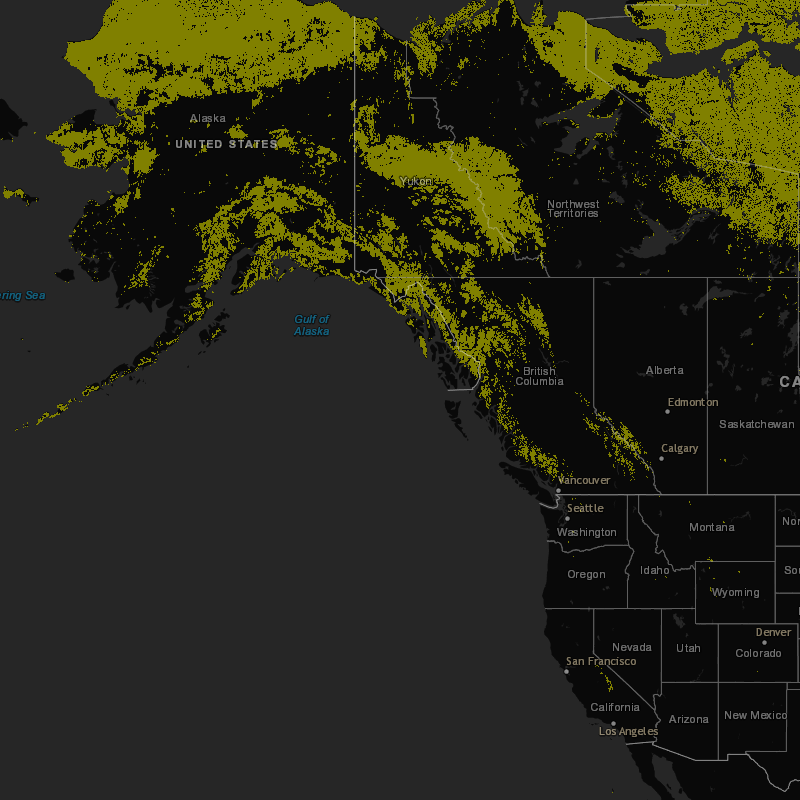 |
| Water Overlay | https://maps-for-free.com/layer/water/z{z}/row{y}/{z}_{x}-{y}.gif | NO | 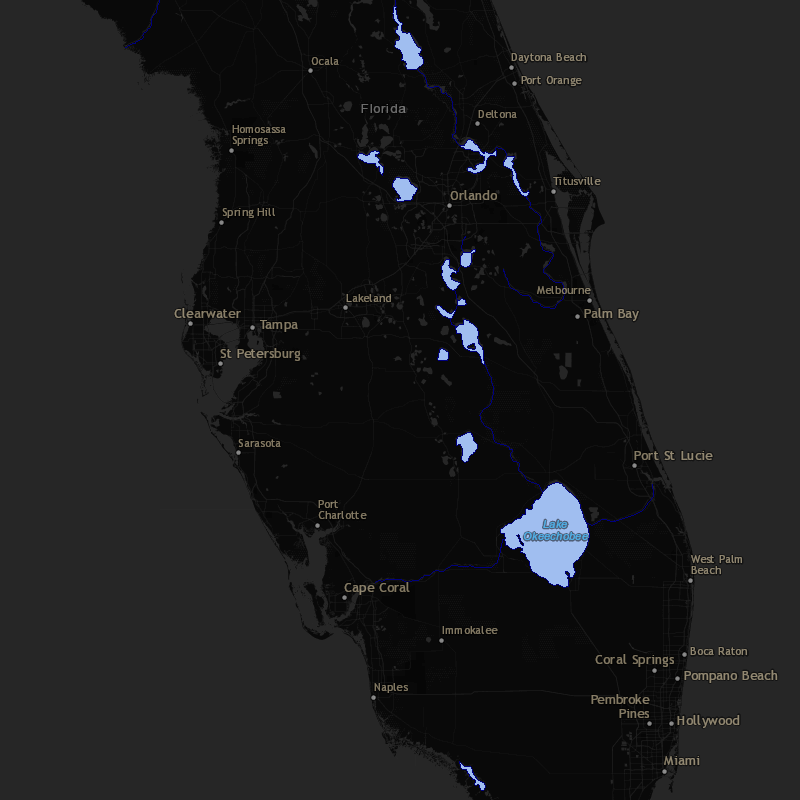 |
| USGS Overlays | (Note: the URLs must not include a file type as shown below. The source returns a .png formatted tile which Limelight XE can automatically detect) | ||
| USGS National Hydrography Overlay | https://basemap.nationalmap.gov/arcgis/rest/services/USGSHydroCached/MapServer/tile/{z}/{y}/{x} | NO |  |
| Open Sea Maps | (Free nautical maps) | ||
| Sea Marks | http://tiles.openseamap.org/seamark/{z}/{x}/{y}.png (note: major marks visible only above zoom level 9 and certain marks only visible above zoom level 12 to prevent data congestion) |
NO |  |
| NOAA Navigational Charts | (Note: the URLs must not include a file type as shown below. The source returns a .png formatted tile which Limelight XE can automatically detect) | ||
| NOAA Navigational Chart Overlay | https://gis.charttools.noaa.gov/arcgis/rest/services/MCS/NOAAChartDisplay/MapServer/exts/MaritimeChartService/MapServer/export?transparent=true&bboxSR=3857&imageSR=3857&DPI=90&size=256,256&bbox={bbox} (note: the dynamic value {bbox} fills in the bounding box of each tile to emulate the normal {x}/{y}/{z} values. This is supported directly by Limelight XE version 2.4 or higher) Various layers can be enabled or disabled on this map server. For more information see NOAA Electronic Navigation Charts for more details. |
NO |  |
| NOAA Electronic Navigation Chart (ENC) Online Overlay | https://gis.charttools.noaa.gov/arcgis/rest/services/MCS/ENCOnline/MapServer/exts/MaritimeChartService/MapServer/export?transparent=true&bboxSR=3857&imageSR=3857&DPI=90&size=256,256&bbox={bbox} (note: the dynamic value {bbox} fills in the bounding box of each tile to emulate the normal {x}/{y}/{z} values. This is supported directly by Limelight XE version 2.4 or higher) Various layers can be enabled or disabled on this map server. For more information see NOAA Electronic Navigation Charts for more details. |
NO |  |
| NOAA Vessel Traffic Heat Maps | (Note: the URLs must not include a file type as shown below. The source returns a .png formatted tile which Limelight XE can automatically detect) | ||
| 2015 | https://coast.noaa.gov/arcgis/rest/services/MarineCadastre/ 2015VesselTransitCounts_AllVessels/MapServer/tile/{z}/{y}/{x} |
NO | 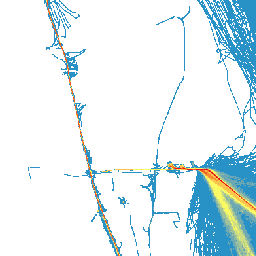 |
| 2016 | https://coast.noaa.gov/arcgis/rest/services/MarineCadastre/ 2016VesselTransitCounts_AllVessels/MapServer/tile/{z}/{y}/{x} |
NO |  |
| 2017 | https://coast.noaa.gov/arcgis/rest/services/MarineCadastre/ 2017VesselTransitCounts_AllVessels/MapServer/tile/{z}/{y}/{x} |
NO | 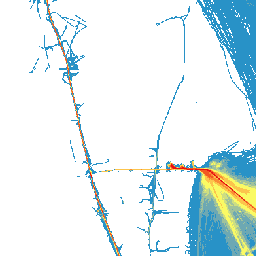 |
| 2018 | https://coast.noaa.gov/arcgis/rest/services/MarineCadastre/ AISVesselTransitCounts2018/MapServer/tile/{z}/{y}/{x} |
NO | 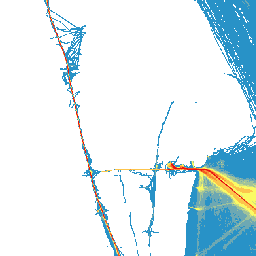 |
| 2019 | https://coast.noaa.gov/arcgis/rest/services/MarineCadastre/ AISVesselTransitCounts2019/MapServer/tile/{z}/{y}/{x} |
NO | 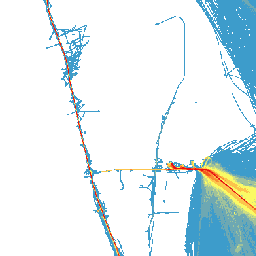 |
| 2020 | https://coast.noaa.gov/arcgis/rest/services/MarineCadastre/ AISVesselTransitCounts2020/MapServer/tile/{z}/{y}/{x} |
NO |  |
| 2021 | https://coast.noaa.gov/arcgis/rest/services/MarineCadastre/ AISVesselTransitCounts2021/MapServer/tile/{z}/{y}/{x} |
NO | 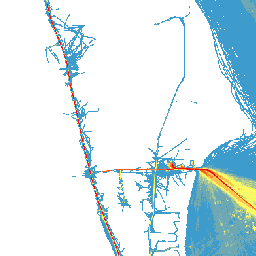 |