 NOAA Electronic Navigational Charts (ENC) Documentation
Overview
The National Oceanic and Atmospheric Administration (NOAA) provides electronic marine charts that encompass the US territory's coastline, great lakes and inland water ways and are updated weekly. These products are provided free of charge on-line and can be integrated easily with Limelight XE version 2.4 or higher. In addition to simply displaying the charts in their entirety, additional layer information can be requested in the URL of the charts. For instance, below is an example showing the ENC online chart with only the Seabed, obstructions and pipelines showing.
https://gis.charttools.noaa.gov/arcgis/rest/services/MCS/ENCOnline/MapServer/exts/MaritimeChartService/MapServer/export?transparent=true&bboxSR=3857&imageSR=3857&DPI=90&size=256,256&bbox={bbox}&layers=show:3

Note the &layers=show:x at the end of the URL. This is used to indicate which specific layers Limelight XE's mapping components are requesting. Layers can be added one after the other (which is the display order) separated by commas. For example, if you want depths and currents, seabed, obstructions and pipelines, traffic routes, special areas you would add &layers=show:2,3,4,5,6 to the end of the url like this:
https://gis.charttools.noaa.gov/arcgis/rest/services/MCS/ENCOnline/MapServer/exts/MaritimeChartService/MapServer/export?transparent=true&bboxSR=3857&imageSR=3857&DPI=90&size=256,256&bbox={bbox}&layers=show:2,3,4,5,6
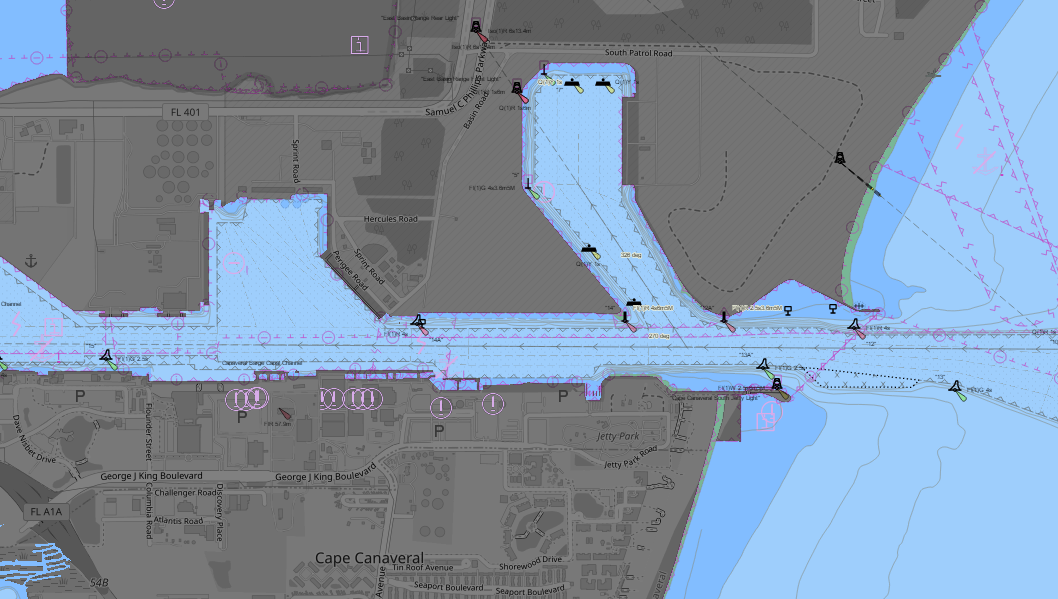
The image above shows these layers on top of the OpenStreetMap base map (with Grayscale enabled). If using the console or other mapping components with the object tracking layer, you can place live ship and ATON data on this imagery (note: the ENC layer alpha level was set to 128 to provide better contrast with the live data).

The table below shows all the possible layers for these charts - combine them as described above for the best mix of imagery and data conjection.
| Layer ID | Name | Comments |
| 0 | General information about the chart | |
| 1 | Natural and man-made features, port features | |
| 2 | Depths, currents, etc. | |
| 3 | Seabed, obstructions, pipelines | |
| 4 | Traffic routes | |
| 5 | Special areas | |
| 6 | Buoys, beacons, lights, fog signals, radar | |
| 7 | Services and small craft facilities | |
| 8 | Data quality | |
| 9 | Low accuracy indication | |
| 10 | Additional chart information | |
| 11 | Shallow water patterns | |
| 12 | Overscale warning |
For more information on these products see U.S. Office of Coast Survey.